Anticorruption in MENA:
Insights and Global Comparisons
Issue Brief, October 2024
Key Takeaways
The MENA region falls in the mid-range on global anticorruption indices: The region is consistent with global trends, in that countries with greater government effectiveness and higher levels of wealth (in terms of per capita GDP) tend to be perceived to be better at combatting corruption, while countries struggling with war and fragility tend to do worse.
There is no significant link between voice and accountability metrics and corruption control: The region differs from global trends, which tend to have a positive correlation between anticorruption indexes and Voice and Accountability (VOA) metrics. The MENA region suffers from relatively low scores on democratization and political participation, and the association between VOA scores and control of corruption is not statistically significant.
Tackling corruption is through technocratic efforts: The broader push towards democratization in the region has largely stalled, making technocratic solutions the most likely way forward in the fight against corruption. Such efforts will emphasize the use of technology to streamline business processes and digitalize public services, for example, rather than increasing political participation or parliamentary oversight.
Further progress can be made in a number of important areas that represent low-hanging fruit: Other potential areas for improvement include enacting or strengthening freedom of information laws, adopting enhanced transparency measures (such as those of the Open Government Partnership), and increased disclosure on the performance and operations of anticorruption agencies.
Introduction
Concerns about corruption have frequently been at the forefront of political unrest throughout the Middle East and North Africa (MENA) region. They were a major driver of the Arab Spring upheavals and the principal flashpoint for protests in Iraq, Lebanon, and Sudan in 2019. In 2022, Transparency International, a leading global anticorruption nongovernmental organization (NGO) argued that corruption was fueling ongoing conflict throughout the MENA region.1
Empirically, the MENA region falls in the mid-range on global anticorruption indices. On average, the region performs better than Sub-Saharan Africa and Eastern and Central Europe and on par with South Asia. It does not perform as well as Latin America or the Asia and Pacific regions. However, these averages mask a wide variation in individual country performance, ranging from the United Arab Emirates (UAE), which comes in at 26th globally in Transparency International’s Corruption Perceptions Index for 2023, to Yemen and Syria, which rank near the bottom at 176th and 177th respectively.2
To what extent is MENA consistent with the rest of the world regarding the relationships between selected economic and governance indicators and the control of corruption? Does the region follow global trends or have a different trajectory? Drawing on the Worldwide Governance Indicators (WGI), this issue brief explores these questions empirically by examining the WGI data from 2000 to 2020.
Overview of MENA’s Performance
This analysis will be grounded on the WGI database.3 The WGI Control of Corruption metric is a composite indicator that draws on over thirty different data sources.4 Many of these sources are perception based, such as the Afrobarometer, Transparency International’s Global Corruption Barometer Survey, and the Gallup World Poll. Others are based on expert rankings, such as Freedom House or the Global Integrity Index.
Some critics argue that the WGI and other global corruption indices lack transparency and comparability over time, suffer from selection bias, and often do not provide tangible ways in which countries can improve their scores.5 Some critics argue that the WGI and other global corruption indices lack transparency and comparability over time, suffer from selection bias, and often do not provide tangible ways in which countries can improve their scores).6 Yet the WGI have been used for over 25 years, and scholars and practitioners view them as one of the most prominent and accepted cross-country comparative databases for monitoring the control of corruption.7
Figure 1 provides a regional average for MENA WGI scores over the past decade. It also breaks down the region by oil and non-oil countries, benchmarking them globally against countries in the high-, upper middle-, lower middle-, and low-income ranges.
FIGURE 1: WGI Average Control of Corruption by Country Group
Source: Authors’ calculations using WGI Control of Corruption data.9
Overall, the MENA region’s average Control of Corruption metric is consistent with the performance of upper-middle-income countries, with the caveat that the latter have slightly improved their rankings over the last 20 years whereas MENA countries have witnessed a decline. With the potential exception of Jordan, which overperforms on anticorruption issues, MENA’s anticorruption scores break down into three categories. At the top, oil producers perform significantly better than upper middle-income countries but not as well as high-income countries. In the early 2000s, MENA’s non-oil countries initially had average corruption control scores above the lower middle-income country averages but have subsequently fallen significantly below, to the point where their scores are now equal to those of low-income countries. The third category, countries in conflict, will be discussed below.
Analysis of Global Correlations
In conducting the analysis, we sought to identify the key correlates of control of corruption in countries worldwide by examining panel data from 2000 to 2020.10 To determine the best model for predicting control of corruption, we tested four possible combinations of our predictor variables. Three were reliant on other WGI indicators, including Government Effectiveness (GE), Voice and Accountability (VOA), and Political Stability (PS).
GE is a composite metric that examines multiple dimensions of public sector performance, ranging from assessments of bureaucratic quality to specific sectoral measures such as the coverage area of public schools, basic health services, and drinking water and sanitation.11 VOA is a proxy for democratic governance, and covers topics such as democracy, human rights, and civil liberties. It also covers issues such as transparency in financial management and the reliability of financial and economic statistics.12 PS covers various dimensions of politically motivated violence, including terrorism.13 We also examined a fourth variable—gross domestic product (GDP) per capita—working on the hypothesis that wealthier countries would be able to invest more resources into building the capacity of their public administration (including various accountability institutions), and would therefore be in a better position to combat corruption.14
Our regression analysis revealed that GE and VOA were the strongest correlates of corruption control globally (Table 1). This pattern held for all but the wealthiest countries, where GE alone was the strongest predictor of control of corruption.
In low-income and lower-middle income countries, a combination of all three, GE, VOA, and PS, provided the strongest correlations with control of corruption, although curiously this result was significantly stronger in low-income countries (R2=0.62) than in lower-middle income countries (R2=0.40). This finding could indicate that the absence of political violence in low-income countries pays a higher dividend in the control of corruption than in wealthier countries.
Table 1: Regression Analysis Results
| Country Group | Best Model Predictor Variables | R2 |
| All WGI Countries | GE, VOA | 0.69 |
| Low-Income | GE, VOA, PS | 0.62 |
| Lower Middle-Income | GE, VOA | 0.40 |
| Upper Middle-Income | GE, VOA | 0.54 |
| Upper-Income | GE | 0.62 |
| MENA | GE, GDP per capita, PS | 0.89 |
| MENA Oil Producers | GE, GDP per capita | 0.74 |
| MENA Non-Oil Producers | GE | 0.74 |
Note: The GDP data is from the World Bank and is in constant 2015 dollars.
Source: Authors’ calculations using WGI data.15
Our findings revealed a pattern in which poorer countries consistently exhibited low control of corruption, while wealthier countries displayed greater variation in corruption control. As we move up the income groups, both the average control of corruption and the standard deviation increase (See table 2). This indicates that the dispersion of control of corruption was greater among wealthier countries, reflecting a higher degree of inconsistency in their corruption control measures. In contrast, poorer countries demonstrated less variation in corruption control, suggesting a more consistent pattern of low control of corruption.
Table 2: Corruption Levels and Variance by Income Group
| Country Group | Average Control of Corruption | Standard Deviation |
| Low Income | -0.85 | 0.44 |
| Lower Middle Income | -0.61 | 0.55 |
| Upper Middle Income | -0.29 | 0.62 |
| High Income | 1.1 | 0.74 |
Note: WGI Average Control of Corruption is measured on a scale of -2.5 to 2.5.
Source: Authors’ calculations using WGI data.16
In the broader MENA region, GE and GDP per capita emerged as the best predictors of control of corruption (The influence of PS is relatively modest). This was also true for oil-producing MENA countries. Both GE and GDP measures could potentially serve as a proxy for broader levels of institutional development, which could explain their correlation with higher scores on the control of corruption metric. However, for non-oil MENA countries, GE alone was the most influential predictor.
Correlation does not prove causality, but these results do indicate that—for most of the world—GE and VOA tend to be closely associated with higher scores of corruption control. It may be that they are indeed influential factors; or it could be that governments that are better at controlling corruption are also better at building infrastructure and respecting the rights of their citizenry.
Control of Corruption in MENA: How Does it Differ?
There are two areas where MENA diverges notably from global trends. First, MENA stands out from the rest of the world in the degree to which VOA is not a particularly powerful factor contributing to the control of corruption. The countries in the region that do best on various anticorruption metrics, such as those of the Gulf Cooperation Council (GCC), are classified as authoritarian by the Economist Intelligence Unit or as “Not Free” by Freedom House.
In many respects, this outcome is not surprising, given the region’s historically poor performance on traditional indices of democratic governance—a topic that has been well documented and analyzed extensively over many decades.17 As the WGI illustrate (see figure 2), the MENA region lags well behind other parts of the world in VOA. Freedom House’s Global Freedom ranking for 2023, lists only four Arab countries as “partially free” (Kuwait, Lebanon, Morocco, and Tunisia). All other Arab countries are listed as “not free”.18
Figure 2: WGI Voice and Accountability (Percentile Rank)
Source: Authors’ calculations using WGI Voice and Accountability data 2011-2021.19
Because the global link between democracy and corruption is less established in MENA, the public lacks an important veto over its leadership, including the ability to overthrow them if perceptions of political corruption become overwhelming. Without this option, the choices become starker, and frustration can more readily boil over into the streets. Perceptions of corruption were a motive during the Arab uprisings and a particularly important driver in the unrest that Iraq, Lebanon, and Sudan experienced in 2019, which led to the overthrow of Sudan’s long-serving authoritarian leader, Omar al-Bashir.
Yet even in MENA countries with relatively free and fair elections, the equations are seldom straightforward. The post-Arab Spring political landscape is often badly fragmented and lacks a clear foundation for stable policymaking.20 Lebanon’s confessional system and its concomitant network of patronage has remained largely intact despite widespread public outrage following the Beirut port explosion and the country’s economic meltdown. The Tishreen (October) protests in Iraq eventually dissipated, forcing the resignation of the prime minister but otherwise leaving that country’s dysfunctional post-invasion political system in place.21 In many countries, confessional, sectarian, or tribal affiliations ultimately trump broader concerns about corruption in the minds of the general public.
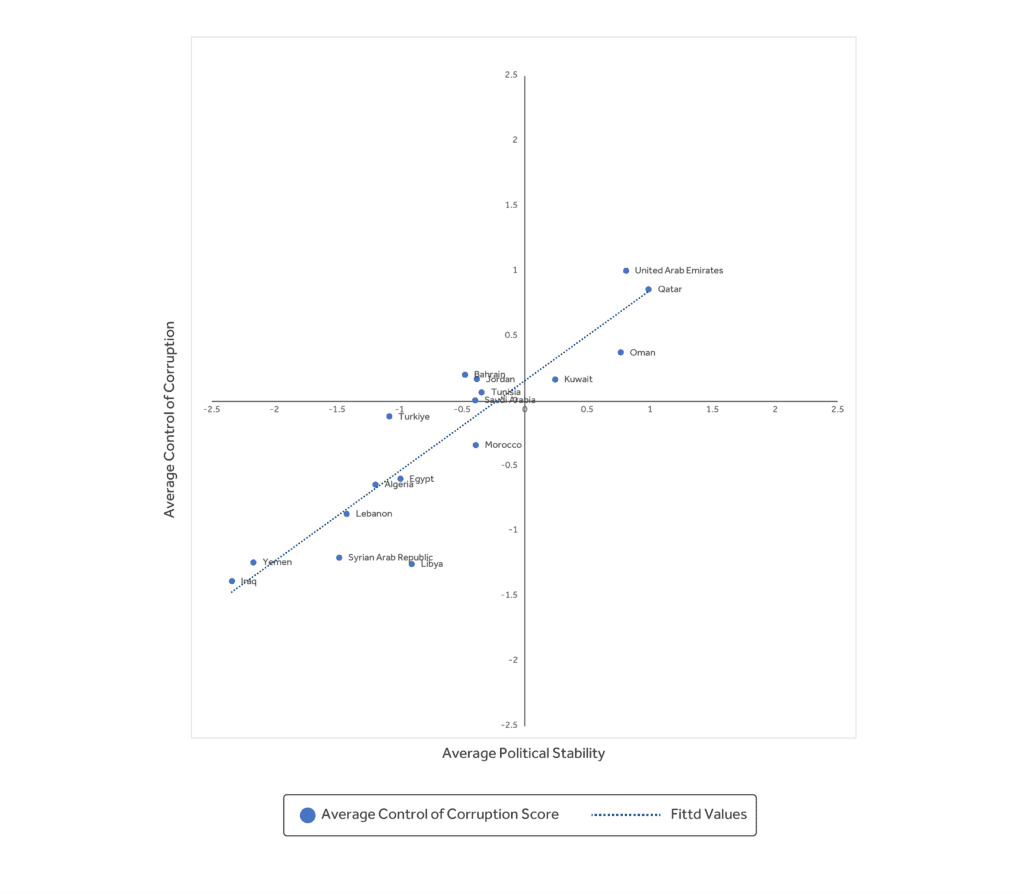
A second conclusion to emerge from this analysis is that MENA is unique in the robust inverse relationship between political instability and control of corruption, as illustrated in figure 3 below. This relationship exists among low-income countries globally, but the correlation between high levels of political violence and high levels of corruption is significantly stronger in MENA.
Figure 3: Political Instability and the Control of Corruption in MENA
Source: Authors’ calculations based on WGI data for 2000-2022.22
This finding is expected. Countries in the midst of civil war or facing chronic sectarian violence often find it difficult to invest extensive financial and political capital in developing robust accountability institutions or even to police their ranks. Virtually, all of the countries at the bottom of Transparency International’s (TI’s) CPI list (Iraq, Lebanon, Libya, Syria, and Yemen) are also categorized as fragile or conflict-prone states. The ever-present threat of physical violence can make it difficult for civil servants to implement the law fairly and impartially. These problems are exacerbated when countries have weak governments and restive coalition partners, who may look to exact a price for their participation and could bring down the government if they chose to.
What Can Be Done?
This analysis underscores that the MENA region is consistent with global trends in a couple of important areas. Both globally and in MENA, countries with greater government effectiveness and higher GDPs per capita tend to be better at combatting corruption. Countries struggling with war and fragility tend to do worse in both MENA and elsewhere, which is a particular problem given the prevalence of conflict-afflicted countries in the region.
There are other areas where MENA diverges from the rest of the world. Higher levels of VOA are often seen as an important tool in reducing aggregate levels of corruption. Yet with democratic norms in retreat throughout the region, it is likely that most of the impetus to combat corruption during the next decade will be orientated towards legal and technocratic improvements in administrative capability rather than advances in public or parliamentary accountability.23 For many who had hoped that the Arab Spring would demonstrate more tangible progress towards public accountability and the rule of law, this conclusion will be disappointing.
Several sets of technocratic improvements hold considerable promise, many of which have a track record of successful implementation within the region. The first is utilizing information technology and business process reengineering to streamline service delivery procedures. There are multiple ways in which such approaches can both eliminate service delivery bottlenecks as well as reduce the opportunity (and the need) for “speed” or facilitation payments. Consistent with its vision to become a trading hub, the United Arab Emirates (UAE) for example has pursued a rigorous program of streamlining customs clearances among other business processes. It now ranks 12th globally in the World Bank’s Logistics Performance Index for 2023, just behind Sweden and ahead of Japan, Spain, and the United States.24 Countries such as Egypt have set up one stop shops for approving investment, significantly reducing processing delays and eliminating administrative discretion—and with it the opportunity for bribery or favoritism.25 Jordan’s procedures for passport and internal document administration were fundamentally restructured, streamlined, and computerized, drastically reducing wait times and professionalizing the service.26
Aligned with such re-engineering efforts has been a significant push to digitize services and place them online, which can enhance both transparency and service delivery. Procedures that are opaque and non-transparent are an invitation for corruption The UAE, and particularly Dubai, have again been global leaders in the push towards rolling out e-government solutions across the public sector. Dubai embraced e-government early and has tenaciously pursued it over the past twenty years. It currently has more than 250 government and private sector services from 35 different entities available through its DubaiNow app.27 Dubai ranks 5th globally in municipal e-governance efforts according to the United Nations Department of Economic and Social Affairs (UNDESA) 2022 survey of electronic governance, ahead of Singapore and Shanghai.28
A third area where technocratic reforms are desperately needed is regulation and competition policy. In 2009, the World Bank produced a pathbreaking study, From Privilege to Competition: Unlocking the Keys to Economic Growth in MENA. The report noted that almost 60% of public officials interviewed from across the region felt that the private sector in their countries was rent-seeking and corrupt.29 As a result, MENA experienced stagnating private investment rates compared with other regions, along with lower diversification of exports, older firms, and limited competition.30 In a finding of particular interest, they noted that MENA governments had undertaken several vital reforms to facilitate private sector-led growth—a trend that continued through the last year of the Bank’s Doing Business report in 2020, when four MENA countries31 were among the top ten reformers globally.32
Yet the World Bank study also found that the uptake was far below what similar reforms have produced in high-growth countries, where private investment was substantially higher. Significant numbers of businesses throughout the region did not believe that rules and regulations would be applied fairly and consistently.33 The report concluded that policy uncertainty and the unequal implementation of regulations are leading constraints to business development, thereby hampering efforts towards greater economic diversification that are at the core of many regional development strategies. The methods of exclusion and extraction are varied and can be both crude and subtle. They include the creation of regulatory barriers to market entry; pressures to have individuals on boards or to take on silent partners; favorable treatment of connected firms in areas such as access to land or customs clearances; preferred access in government procurement; and even indirect pressures like freezing bank accounts and suspending visas. The move towards a more transparent, fair, and predictable regulatory framework will be the next great governance challenge for many countries in the region.
A final priority area for technocratic reforms is money laundering and illegal asset transfers—areas that have been a priority for many regional countries for decades partly because of their role in corruption and partly because of concerns surrounding terrorism financing. The region presents a varied picture on global indices, such as the Basel Anti-Money Laundering Index. The Basel Index’s assessment for 2022 reveals a picture that is somewhat at odds with global anticorruption rankings such as WGI and TI’s CPI.34 Tunisia, Morocco, Bahrain, Jordan, Egypt, and Qatar all score better than the global average on the index. The UAE, on the other hand, scores poorly, coming in second to last among ranked countries in MENA and in the bottom 40% globally, although it has recently taken steps to improve its performance in this area.35
Beyond these technocratic reforms, there remain some areas under the broader VOA rubric where progress remains possible. One important area is transparency, where MENA lags behind many other regions. Only six countries have Right to Information laws (Jordan, Kuwait, Lebanon, Morocco, Tunisia, and Yemen), and the laws that do exist often fall well below global standards.36 Only three regional countries—Jordan, Morocco, and Tunisia—belong to the Open Budget Partnership.37 Even countries such as the UAE38 can fail to disclose some types of routine economic, social, and fiscal data.39
Reporting on corruption itself is often patchy throughout the region. Some national anticorruption agencies produce detailed and comprehensive annual reports, such as Iraq, Jordan and Kuwait.40 Others provide partial information or none at all. A major push towards better data reporting on the staffing, budgets, and operations of these agencies would generate information that will allow governments and their citizenry to better benchmark their performance and address chronic problems.
For the region as a whole to make progress, it is imperative to tackle the problem of corruption in fragile states, which has been one of the toughest challenges confronting anticorruption efforts globally. For a long time, scholars and practitioners tended to shy away from tackling corruption in these settings, viewing it as essentially a second order consideration and less important than peace and security. However, there are signs that this view is changing, and there is a growing recognition that it can be difficult to make progress in settling conflicts while corruption remains rampant.41 Over the past decade, some efforts have been made to develop and curate lessons for combatting corruption in contexts of extreme fragility.42 This remains a work in progress, and a major push within MENA to understand the unique problems posed by fragile states and where steps have been effective in these contexts would be valuable. There is unlikely to be any “one size fits all” solution, as many of these countries are grappling with their own unique set of institutional and political economy challenges.
Taken collectively, the approaches outlined above provide a realistic way forward that is aligned with the MENA region’s aspirations as well as the underlying political economy dynamics within many Arab countries. Implemented carefully and systematically, they will improve countries’ performance and reverse the perception that many Arab governments43 are not serious about combatting corruption.44
