
Voice, Accountability, and Economic Growth in the MENA Region
Analysis Paper, April 2023

Former Nonresident Senior Fellow

Former Nonresident Fellow

Investor, D.E. Shaw
 download
Abstract
Polling data from across the Arab world suggests a growing disillusionment with democracy and its role in fostering economic development. While such disillusionment is understandable, it is not necessarily accurate. This paper reviews analytic work and empirical data on governance, economic growth, foreign direct investment, and export diversification in an effort to understand whether metrics of “voice and accountability” (which are often used as proxies for democratic development) are correlated with higher levels of economic growth and performance.
The answer is complicated yet ultimately runs against conventional wisdom. When the Middle East and North Africa (MENA) region as a whole is considered, voice and accountability (VOA) does indeed appear to be inversely correlated with per capita Gross Domestic Product (GDP) levels. Yet this may reflect the fact that many high-income oil-producing states are autocracies rather than underscoring the irrelevance of VOA considerations for stable and broad-based economic growth. When one focuses more narrowly upon non-oil states in the region, VOA is closely correlated with more robust levels of economic growth. Measures of VOA are also closely correlated with a host of other “good governance” indices that move together, and they may be quite influential in advancing metrics such as government effectiveness and control of corruption that are more closely linked to economic growth, even in oil producers.
Introduction
The Middle East and North Africa (MENA) region is experiencing growing disillusionment with democratic norms and institutions. A recent poll of nine countries by the Arab Barometer noted that all of them experienced a substantial rise in those believing the economy is weak under a democracy, which is now the dominant view in nearly every country surveyed.1 In each of these countries, significant majorities expressed support for effective government regardless of the form it takes.
In many respects, such disillusionment is understandable. Over the past two decades, the MENA region has witnessed revolutions, successive waves of mass protest, and deadly civil wars. After an initial retreat, autocrats have made a comeback, as political transitions have stalled or been reversed. Through it all, GDP growth per capita has oscillated, tied more to cyclical variations in global energy markets than to structural improvements in competitiveness, investment climate, or export diversification.2 Inequality and poverty have grown, while youth unemployment has remained persistently high.3 The global pandemic and, more recently, inflation and food insecurity have further compounded public frustration and concern.
Are authoritarian regimes truly better at managing the levers of economic growth than those with higher levels of voice and accountability (VOA)? Or can regimes that score better on established VOA metrics actually out-perform autocratic regimes over time? While current skepticism regarding democracy and economic development in MENA is widespread and growing, it may not be accurate. This analysis paper reviews analytic work and empirical data on governance, economic growth, foreign direct investment (FDI), and export diversification in an effort to address this question.
The answer, as evidenced below, is complicated yet ultimately runs against the conventional wisdom. When the MENA region as a whole is considered, VOA does indeed appear to be inversely correlated with per capita GDP levels, while other governance metrics, such as regulatory quality, the rule of law, and control of corruption are strongly and positively correlated with economic growth. However, this negative association may reflect the fact that many high-income oil-producing states are autocracies rather than underscoring the irrelevance of VOA considerations for stable and broad-based economic growth.
When one focuses more narrowly upon non-oil states in the region, VOA is closely correlated with more robust levels of economic growth. Measures of VOA are also closely correlated with a host of other “good governance” indices that move together, and they may be quite influential in advancing metrics such as government effectiveness and control of corruption that are more closely linked to economic growth, even in oil producers. Beyond these elements, VOA is likely to contribute to the development of a broader and more diverse economy that avoids the commodity boom-and-bust cycles typical of many developing countries, which will lead to more stable and sustained growth over time.
A Review of the Evidence on VOA
Our starting point for this analysis is the VOA metric in the World Bank’s Worldwide Governance Indicators (WGI).4 (Later in the paper, we will explore the efficacy of another VOA indicator by the Legatum Institute). VOA itself is a broad metric, covering both political dimensions—such as democratic institutions, free elections, and political rights—as well as civil society protections such as freedom of association, press freedom, human rights, and access to information. The WGI VOA metric is a composite derived from over 30 sources, some of which are survey-based and others rely upon expert assessments.5 The WGI have existed for 24 years and cover all the countries in the MENA region. They have been subject to several critiques but remain one of the most widely utilized and accepted sets of governance metrics.6
Over the past three decades, there has been an explosion of empirical work on the contribution of governance and institutions to economic growth. Globally, there is a strong correlation between countries who score well on established VOA metrics and those who enjoy high levels of economic development.7 This relationship has been relatively well-established in the literature on political science and development economics, and it reflects the fact that many Organisation for Economic Co-operation and Development (OECD) countries enjoy strong democratic norms, robust civil societies, and high levels of GDP per capita. This relationship is illustrated in figure 1, which contains global data for the year 2020. Countries from the MENA region are highlighted in red and those from the OECD are highlighted in blue.
FIGURE 1: Voice and Accountability and per Capita GDP

Source: Authors’ calculations using data from Haver Analytics and the WGI.8
This figure also includes two trend lines for both the world and for the MENA region. For the world, the line slopes up, indicating a positive relationship between higher VOA scores and levels of development, as measured by GDP per capita. For the MENA region, the line slopes down, reflecting the fact that many higher-income countries in the region do not fare well on global VOA metrics. The fuller story, however, is more nuanced and complex.
Scholars face a number of pressing conceptual and empirical challenges in unraveling the impact of VOA on economic growth and development. Conceptually, the underlying relationships have yet to be definitively established. Does VOA lead to increased societal pressure for effective administration, control of corruption, and a predictable legal framework, thereby contributing to higher levels of foreign and domestic investment and ultimately greater economic growth? Or do higher levels of economic growth enable the creation of an expanding middle class, which pressures the state for more equitable treatment and a greater say in how they are governed? Or is a third variable driving changes in both economic growth and VOA? Can VOA considerations be more important at different stages of development? And is the MENA region unique and an outlier from global trends?
A number of researchers have sought to press beyond these correlations and further explore the underlying causal relationships. Many of these analyses utilize WGI indicators as their point of departure. However, their use of varying statistical approaches and methodologies and their focus on different countries and time periods makes it hard to generalize across these results and arrive at definitive conclusions. Beyond these methodological challenges, the data itself often defies easy explanation. As Daniel Kaufmann, one of the principal creators of the WGI, noted in his reflections upon their 25th year anniversary, “the data points to significant variation across countries within an income group or region, as well as across governance dimensions in the same country or region.”9
Most empirical studies maintain that “governance matters” and that better governance correlates with faster growth and higher income levels. One of the first empirical analyses in the MENA region by Rock-Antoine Mehanna, Yousef Yazbeck, and Leyla Sarieddine looked at 23 MENA countries between 1996 and 2005. They concluded, “the econometric results substantiate… that the impact of the level of economic development on governance is weaker than the impact of governance on economic development.”10 A 2016 study by Noha Emara and I-Ming Chiu looked at 188 countries between 2009-2013, with a particular focus upon MENA. They created a composite index of the six WGI indicators and found that it explained as much as 81% of variations in growth during the period in question, amounting to an extra 2% increase in GDP per capita per year.11
A working paper supported by the Asian Development Bank (ADB) in 2014 looked at 190 countries between 1998 and 2011, including those from the MENA region. On average, they found that developing Asian countries with a “surplus” (i.e., scores above the mean) in government effectiveness, regulatory quality, and control of corruption were observed to grow economically nearly two percentage points faster than countries with a deficit in this area. With regard to MENA, they found that countries with a governance “surplus” in political stability grew about 2.5 percentage points more rapidly than countries with governance deficits. For government effectiveness, the differential was 1.6 percentage points, and for control of corruption it was 1.7 percentage points. However, they also found that for the other areas of governance, such as rule of law and VOA, the difference in growth performance between surplus and deficit countries was not statistically significant.12
Several additional studies have reached similar conclusions and placed greater emphasis on other metrics. An analysis of 145 countries from 2002-2014 by Tharanga Samarsinghe noted the importance of controlling corruption in advancing economic growth, whereas VOA did not appear to be significant.13 A review of 199 countries from 1996-2011 by Eva Medina-Moral and Vincente J. Montes-Gan found that economic freedom was the most important factor promoting development.14 Medina-Moral also found that governance factors were increasingly important as countries improve their level of development, with emphasis upon a better regulatory framework and stronger rule of law.15 An analysis of the six Gulf Cooperation Council (GCC) countries from 1996-2019 found that the control of corruption, the rule of law, and government effectiveness and regulatory quality had a positive, statistically significant impact on economic growth. (This study did not look at the role of VOA or political stability in these countries.)16
Other analyses have underscored the contention that VOA considerations may become more influential as countries progress up the development ladder. For developing Asian countries, the ADB study noted higher VOA scores might initially serve as a brake on development, and countries under the mean were likely to grow up to 2 percentage points faster annually than countries in surplus. The authors went on to maintain that low-income countries should perhaps strive for more effective government, better regulatory quality and rule of law, and tighter control of corruption.17 Yet they maintained that progressing to higher income status calls for improving governance quality with respect to citizen participation and government accountability, arguing that middle- and high-income countries are likely to gain substantial rewards from providing their citizens with greater voice, political stability, and world-class institutions.18 These findings were reinforced in an analysis by Zhuo et al., who focused upon 31 developed countries from 2002 to 2018. Zhuo and his colleagues found a direct and significant effect of rule of law, control of corruption, and voice and accountability on economic growth in developed countries.19 In a study of 111 high- and low-income countries between 1996 and 2018, Fadi Fawaz, Anis Mnif, and Ani Popiashvilli noted VOA considerations had a slightly negative impact on low-income countries and a positive effect upon higher-income developing countries.20
Regional variations may also come into play. The ADB study noted that, at an aggregated level, the linkage of VOA with GDP per capita and higher rates of GDP growth is significantly weaker for Asia than for the rest of the world, whereas the effect of government effectiveness and regulatory quality on economic performance was significantly higher.21 The MENA region, with its vast hydrocarbon resources and relatively low scores on democratization and VOA metrics, is viewed by many as an outlier from global trends. As one scholar noted, the majority of MENA countries have achieved a “relatively high but fragile standard of living” for their citizens that does not necessarily depend upon sound governance.22 And Emara and Chiu found that their composite governance index, while accounting for 81% of growth variation globally, explained only around 36% of the variation in MENA.23
Yet while the MENA region may have its unique features and challenges, it does not appear to be immune from global trends, even with regard to the role of VOA considerations in fostering economic growth. In their analysis of 23 countries in MENA, Mehanna, Yazbeck, and Sarieddine found that, among the six WGI indicators, VOA, government effectiveness, and control of corruption had the strongest impact on economic development.24 And among researchers who were inclined to credit other WGI indicators with being more influential, few were willing to dismiss VOA considerations as unimportant.
Except for political stability, all of the WGI indicators behave in a similar way and are highly correlated.25 It could be that VOA moves in tandem with other metrics of “good governance,” such as the control of corruption and government effectiveness, which encourage greater investment and, ultimately, higher diversification. It could be that VOA is a critical factor in driving such governance improvements, as the middle class seeks to level the playing field and end privileged access and the preferential treatment of favored firms. Or it could be that higher levels of VOA generate pressure for state improvement in other areas, such as public education and infrastructure, that facilitate greater export diversification and more rapid growth. These are questions that we will address below.
Methodology and Analysis
Methodology
Drawing upon data from the WGI between 2000 and 2020, as well as World Bank data on economic trends, we created a number of heatmaps for “p-value filtered” correlations that captured the relationships between WGI governance indicators—voice and accountability, political stability and absence of violence/terrorism, government effectiveness, regulatory quality, rule of law, and control of corruption—and three economic metrics: GDP per capita, FDI inflows, and export diversification.
We started by running regressions between each governance indicator and each economic outcome variable. Since we were working with longitudinal data, we used both fixed effects (FE) and random effects (RE) models to control for time-invariant confounding (anomalies). FE-models determine the individual effects of unobserved, independent variables as a constant over time, whereas RE-models determine the individual effects of unobserved, independent variables as random variables over time. After running both models, we established whether the FE- or RE-model corresponds better with our data by using the Hausman-Test (for verification). From there, we evaluated whether each governance indicator was a significant determinant of the economic outcome variables by analyzing the p-value at a 0.1 cutoff value. If the determinant was significant, we included this relationship in our heatmap, but if it was not, then this relationship was left blank.
Finally, for each relationship that was determined to be significant by our regression model, we picked a color shade corresponding to the relationship’s correlational strength (red for negative correlations and green for positive) to compose the outputted heatmap.26 In the end, this process yielded a set of correlations filtered by relational significance for various country groups.
Does VOA Matter Globally?
Figure 2 below provides a heat map of the correlations between WGI indicators for all countries from 2000 to 2020 compared against GDP per capita, FDI flows, and export diversification. Except for political stability, the regression findings are more or less what one would expect if the WGI governance indicators are closely linked with higher levels of economic growth and development. There are strong positive correlations between government effectiveness, regulatory quality, rule of law, and control of corruption, as the independent variables, and GDP per capita as the dependent variable. Statistically, these relationships have greater explanatory power than the reverse hypothesis—that economic indicators are capable of determining the evolution of governance indices.27 This finding is consistent with that of other scholars, such as Mehanna, Yazbeck, and Sarieddine, cited above.
FIGURE 2: All Countries: P-Value Filtered Correlation for Economic Outcomes

Source: Authors’ estimations based on data from Haver Analytics and the WGI.28
On a global scale, the metrics utilized for VOA also show a fairly robust positive correlation with growth. The relationship between the WGI VOA metric and growth is slightly weaker than the relationship utilizing a modified VOA metric, which was developed from an indicator originally advanced by the Legatum Institute.29 The modified Legatum indicator focuses less on the political dimensions of VOA (parliaments, elections, political parties, etc.) and more on the robustness of civil society. This may indicate that traditional measures of VOA, whether employed by the WGI or organizations such as Freedom House, could potentially undervalue the strength and robustness of civil society, or at least fail to adequately capture its more apolitical dimensions. This topic would be of considerable relevance in many MENA countries and is worthy of further exploration.
Indicators such as government effectiveness, regulatory quality, the rule of law, and control of corruption that are determinants of GDP per capita are also capable of forecasting FDI inflows. These correlations remain positive, although somewhat less robust. This result is not surprising. One would expect various governance metrics to be positively correlated with FDI inflows, yet FDI is likely to depend on a host of additional factors as well, such as the size of the local market, a given country’s natural resource endowments, and its sources of comparative advantage. When it comes to export diversification, regulatory quality is the strongest determinant, while the other indicators do not appear to be particularly influential. This makes sense intuitively, as a fair, transparent, and predictable regulatory framework would presumably favor a broader swath of economic actors, encouraging greater diversification. However, there is limited evidence from this dataset where higher levels of VOA would have a direct impact upon economic diversification through the mechanisms of better regulatory outcomes.
Is the MENA Region Different?
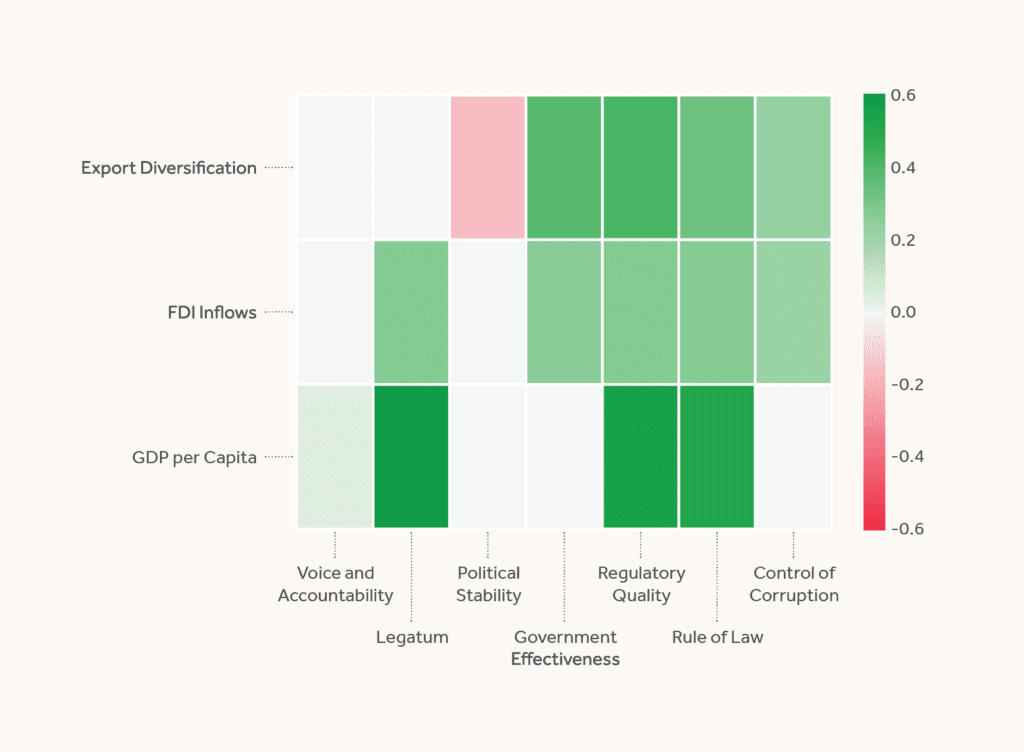
Figure 3 provides a heatmap for the MENA region throughout the same period. At first glance, it appears to vary from the global results in several important respects. The most notable is the moderate negative correlation between VOA considerations and economic growth. (The modified Legatum metric is neutral and reflects no strong relationships one way or another.) This would lend credibility to the hypotheses advanced by the ADB and others that the region is indeed a global outlier on VOA issues; and in MENA, high VOA rankings and high levels of national wealth are not necessarily correlated. Government effectiveness is also not strongly correlated with GDP per capita in MENA, while regulatory quality, rule of law, and control of corruption remain highly linked.
FIGURE 3: MENA Countries: P-Value Filtered Correlation for Economic Outcomes
Source: Authors’ estimations based on data from Haver Analytics and the WGI.30
A closer examination reveals these relationships to be significantly more complex. Figures 4 and 5 break MENA down into oil-producing and non-oil-producing states. It is clear that the negative association between VOA and economic growth is largely a function of the fact that the wealthiest countries in MENA are both autocracies and also heavily endowed with hydrocarbon resources. There is a large literature on rentier states that captures how elites in such states are often capable of co-opting and buying off opposition and winning public loyalty through jobs and subsidies. Oil may allow countries in the region to short-circuit the traditional relationship between VOA and wealth, and their abundant mineral endowments allow them to attain high standards of living without corresponding increases in voice and accountability.
FIGURE 4: Heatmap for MENA Oil Countries
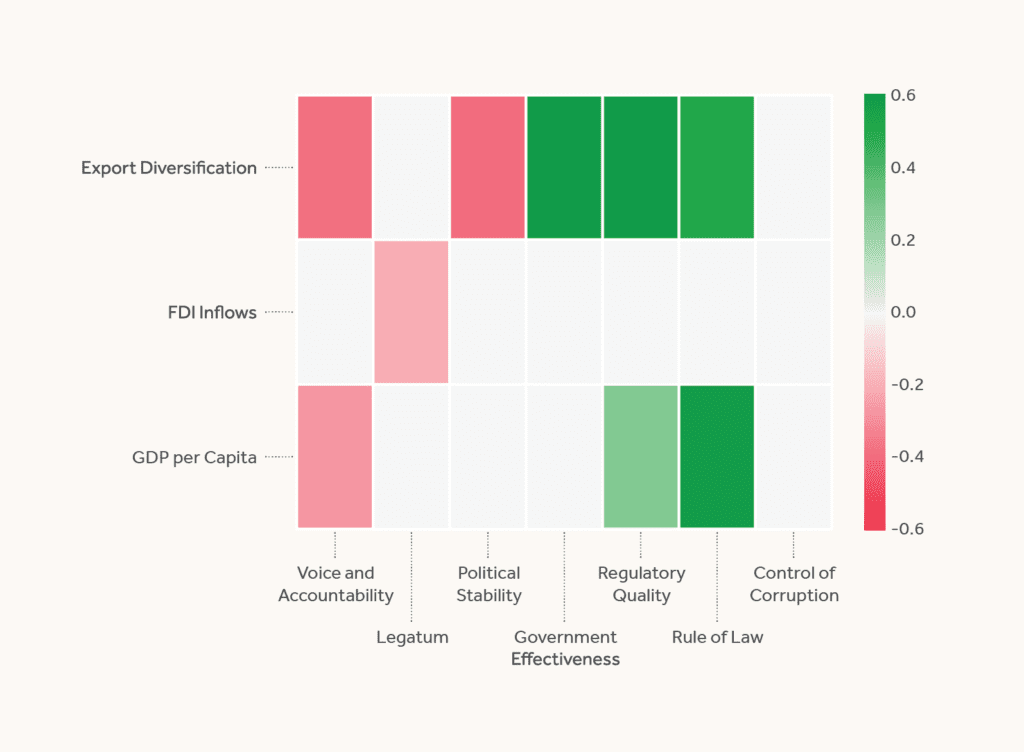
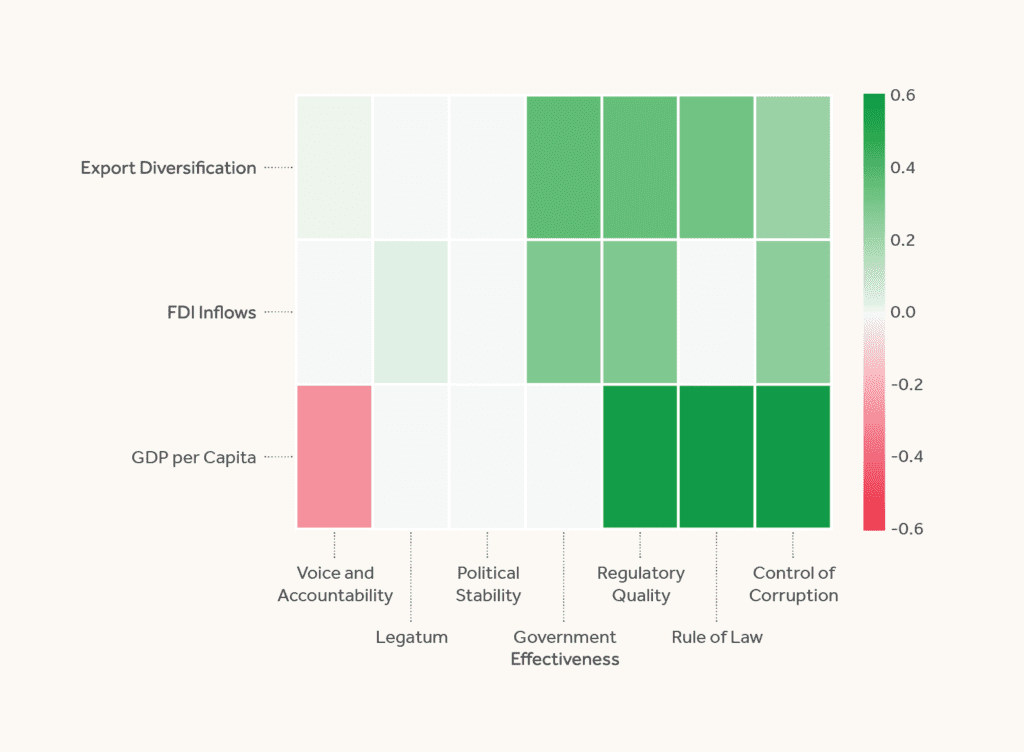
FIGURE 5: Heatmap for MENA Non-Oil Countries

Source: Authors’ estimations based on data from Haver Analytics and the WGI.31
This is not the case for those countries in MENA without oil, where VOA considerations are closely and positively correlated with GDP per capita for both the WGI and the modified Legatum indices. Curiously, most of the remaining governance indicators show relatively weak correlations—an anomaly that is not fully understood. Some of the governance indicators show moderately strong correlations with FDI. And several indicators—government effectiveness, regulatory quality, rule of law, and control of corruption—are strongly correlated with export diversification. It appears that one of the main dividends for good governance in MENA non-oil countries comes in the form of enhanced FDI—a result that is not present in MENA’s oil-producing countries.
In MENA’s oil producers, only the rule of law and regulatory quality have positive correlations with GDP per capita. For export diversification, the governance indicators are somewhat split. VOA and political stability carry negative correlations, while government effectiveness, regulatory quality, and rule of law have strong positive correlations. Non-oil countries also have strong correlations on these indicators as well as that of control of corruption.
What should we make of this? The most striking difference between the oil and non-oil producing countries in MENA is the inverse correlation between VOA and GDP per capita from negative in oil MENA to positive in MENA non-oil. This indicates that the region is not homogenous. Many of the standard relationships and correlations that one would expect to apply globally also apply to non-oil producing states in the region, albeit with differences in intensity and emphasis. Wealthy oil-producing states flip the script on issues of VOA and GDP per capita. They also diverge on issues of FDI inflows, where MENA non-oil countries are again more consistent with global trends. There are strong positive correlations between most of the governance indicators and export diversification in both oil and MENA non-oil countries, with the notable exceptions of VOA and political stability.
VOA and Levels of Development
As noted in the literature review above, several scholars have argued that VOA considerations become more important and closely correlated with income as countries improve their overall level of wealth. Our findings, presented in detail in figures 6-9, tend to reinforce these arguments. Using World Bank criteria, we divided the global sample into quartiles. We found that for low-income countries, many of the good governance indices are moderately or weakly correlated with negative results, including both the WGI and modified Legatum VOA indicators. In the second quartile, lower-middle-income countries, the WGI VOA metric had flipped to moderately positive whereas the Legatum indicator remained weakly negative. In fact, all WGI metrics are associated with economic gains, with government effectiveness being particularly influential.
FIGURE 6-9: Countries by Income: P-Value Filtered Correlation for Economic Outcomes, 2000-2020
Figure 6: Low-Income Countries

Figure 7: Lower-Middle Income Countries

Figure 8: Upper Middle-Income Countries

Figure 9: High-Income Countries
Source: Authors’ estimations based on data from Haver Analytics and the WGI indicators.32
Within the third quartile, upper-middle-income countries, there was no strong correlation for either VOA indicator, although many other WGI governance indicators remain weakly or moderately correlated in a positive direction. And the fourth category, high-income countries, revealed a weak positive correlation with the WGI VOA indicator and a very strong positive correlation with the modified Legatum VOA indicator. Regulatory quality and rule of law are also strongly correlated with GDP per capita. Most of the governance indicators are also closely and positively linked with FDI flows and export diversification.
Although not definitive, these findings would lend credence to the view that VOA considerations tend to become more strongly correlated with wealth as a given country’s per capita GDP increases. It may be that countries reach a “tipping point” somewhere between low and lower-middle-income status, in which governance gains accumulate and begin paying positive dividends in terms of increases in GDP per capita and higher FDI inflows. Another tipping point may exist in the transition from upper middle-income to high-income status.
Conclusion
Several conclusions emerge from this analysis. Globally, there is a robust positive correlation between countries that score well on established VOA metrics and those that enjoy high levels of economic development. This relationship has been well-established in the literature and is further reinforced by our analysis. Other governance metrics, such as government effectiveness, regulatory quality, rule of law, and control of corruption are also closely correlated with higher levels of GDP. To a lesser extent, these metrics are also correlated with higher FDI flows. And regulatory quality is highly correlated with export diversification.
Second, the MENA region is an obvious outlier to this general trend. The generous hydrocarbon resource endowments of many MENA countries allow them to short-circuit the established relationship between VOA metrics and GDP per capita. Yet it is less that the region itself is an outlier than the region’s oil producing states are the outliers. For MENA countries without oil, VOA considerations are quite robustly correlated with higher levels of GDP per capita. And for all MENA countries, indices such as government effectiveness, regulatory quality, and rule of law are closely and positively correlated with greater export diversification—a major priority for many countries in the region.
Third, as several earlier scholars have noted, the influence of VOA considerations appears to vary as countries become wealthier. The trajectory is not linear but appears to grow stronger and then weaker again for reasons that are not fully understood. VOA and other “good governance” metrics appear to be weakly or moderately negatively associated with per capita GDP at lower levels of development. They then flip positive and appear to be linked both to higher levels of economic development and to more rapid economic growth in the transition to lower-middle-income countries. With exceptions, they tend to be more strongly positive in their relationships with GDP per capita, FDI inflows, and export diversification for high-income countries. Different VOA metrics can also noticeably affect these correlations, with the modified Legatum index (which as noted above is less politically weighted and more oriented towards measuring the robustness of civil society) showing higher levels of correlation than the WGI VOA index, which explicitly monitors democratic practices and institutions.
It is clear that metrics such as VOA should not be readily dismissed, even in the MENA region. The high levels of GDP per capita with relatively low VOA scores are an exception globally and the product of MENA’s unique natural resource endowment, which will not last forever.
Longstanding goals to diversify MENA economies will rely on a variety of factors, including a host of “good governance” metrics such as government effectiveness, regulatory quality, and rule of law. VOA considerations are intimately embedded within and interrelated with this broader suite of governance metrics.
Setting normative considerations aside and looking purely at the empirics of growth, the region’s policymakers and publics would be wise to recognize that greater voice and accountability is an asset in reaching their broader objective of more dynamic and sustainable economic growth.
Endnotes
1 Jessie Williams, Sarah Habershon, and Becky Dale, “Arabs Believe Economy is Weak Under Democracy,” July 6, 2022, Arab Barometer, https://www.arabbarometer.org/media-news/arabs-believe-economy-is-weak-under-democracy/.
2 World Bank World Development Indicator (WDI) Database, “GDP growth (annual %) – Middle East & North Africa,” accessed April 2, 2023, https://data.worldbank.org/indicator/NY.GDP.MKTP.KD.ZG?locations=ZQ.
3 Lydia Assouad, “Inequality and Its Discontents in the Middle East,” Carnegie Middle East Center, March 12, 2020, https://carnegie-mec.org/2020/03/12/inequality-and-its-discontents-in-middle-east-pub-81266.
4 World Bank, “Worldwide Governance Indicators,” Interactive Data Access, accessed November 10, 2022, https://info.worldbank.org/governance/wgi/Home/Reports.
5 World Bank, “Worldwide Governance Indicators,” Documentation, accessed November 10, 2022, https://info.worldbank.org/governance/wgi/Home/Documents#wgiDataSources.
6 Daniel Kaufmann, Aart Kraay, and Massimo Mastruzzi, The Worldwide Governance Indicators: Methodology and Analytical Issues, Analysis Paper, (Washington, DC: Brookings Institution, September 2010), https://www.brookings.edu/wp-content/uploads/2016/06/09_wgi_kaufmann.pdf; Daniel Kaufmann, Aart Kraay, and Massimo Mastruzzi, The Worldwide Governance Indicators Project: Answering the Critics, Policy Research Working Paper 4149, (Washington, DC: World Bank, March 2007), https://openknowledge.worldbank.org/server/api/core/bitstreams/acb720f6-846e-5fa3-8ca7-67c65b3ece1a/content.
7 For example, see Stephen Knack, ed., Democracy, Governance and Growth (Ann Arbor: University of Michigan Press, 2003); See also Philip Keefer, A Review of the Political Economy of Governance: From Property Rights to Voice (Washington DC: World Bank Group, May 2004), http://web.worldbank.org/archive/website01241/WEB/IMAGES/13153132.PDF.
8 World Bank, “Worldwide Governance Indicators;” Haver Analytics Database, accessed November 10, 2022, https://www.haver.com/.
9 Daniel Kaufmann, “It’s Complicated: Lessons from 25 Years of Measuring Governance,” Brookings Future Development (blog), September 30, 2021, https://www.brookings.edu/blog/future-development/2021/09/30/its-complicated-lessons-from-25-years-of-measuring-governance/
10 Rock-Antoine Mehanna, Yousef Yazbeck, and Leyla Sarieddine, “Governance and Economic Development in MENA Countries: Does Oil Affect the Presence of a Virtuous Circle?” Journal of Transnational Management 15, no. 2 (June 2010): 117-150, https://doi.org/10.1080/15475778.2010.481250.
11 Noha Emara and Ming Chiu, “The Impact of Governance on Economic Growth: The Case of Middle Eastern and North African Countries,” Topics in Middle Eastern and African Economies, 18, no. 1 (May 2016), https://ecommons.luc.edu/meea/231/.
12 Xuehui Han, Haider Khan, and Juzhong Zhuang, “Do Governance Indicators Explain Development Performance? A Cross-Country Analysis,” ADB Economics Working Paper Series, No. 417, November 2014, https://www.adb.org/publications/do-governance-indicators-explain-development-performance-cross-country-analysis.
13 Tharanga Samarasinghe, “Impact of Governance on Economic Growth,” Munich Personal RePEc Archive (MPRA), November 3, 2018, https://mpra.ub.uni-muenchen.de/89834/.
14 Eve Medina-Moral and Vincente J. Montes-Gan, “Economic freedom, good governance and the dynamics of development,” Journal of Applied Economics 21, no. 1 (November 2018): 44-66, https://doi.org/10.1080/15140326.2018.1526873
15 “Even taking for granted that governments must be committed to improve all components of the institutional framework, our results show that there is a sequence of institutional development. A country needs to ameliorate some basic institutions before it can improve others, despite their importance. For instance, the priority for the less developed countries must be economic freedom.” See Medina-Moral and Montes-Gan, “Economic freedom,” 64.
16 Maryam Al-Naser and Allam Hamdan, “The Impact of Public Governance on Economic Growth: Evidence from Gulf Cooperation Council Countries,” Economics & Sociology 14, no. 2 (December 2019): 85-110, https://doi.org/10.14254/2071-789X.2021/14-2/5.
17 Han, Khan, and Zhuang, “Do Governance Indicators Explain Development Performance.”
18 Ibid., 18.
19 Zhuo Zhang, Sultan Musaad O. Almalki, Muhammad Bashir, and Khan Sher, “Underlying the Relationship Between Governance and Economic Growth in Developed Countries,” Journal of the Knowledge Economy 12, (June 2021): 1314-1330, https://doi.org/10.1007/s13132-020-00658-w.
20 Fadi Fawaz, Anis Mnif, and Ani Popiashvili, “Impact of Governance on Economic Growth in Developing Countries: A Case of HIDC vs. LIDC,” Journal of Social and Economic Development 23 (June 2021): 44-58, https://doi.org/10.1007/s40847-021-00149-x.
21 Han, Khan, and Zhuang, “Do Governance Indicators Explain Development Performance,” 18.
22 Noa Emara and Eric Jhonsa, “Governance and Economic Growth: Interpretations for MENA Countries,” Topics in Middle Eastern and African Economies 16 no. 2 (September 2014): 164, https://ecommons.luc.edu/meea/199/.
23 Emara and Chiu, “The Impact of Governance on Economic Growth,” 136.
24 Mehanna, Yazbeck, and Sarieddine, “Governance and Economic Development in MENA Countries,” 145.
25 On the correlation between indicators, see Isabel Gallego-Álvarez, Miguel Rodriguez-Rosa, and Purificación Vicente-Galindo, “Are Worldwide Governance Indicators Stable or Do They Change Over Time? A comparative Study Using Multivariate Analyses,” Mathematics 9, no. 24 (December 2021), https://doi.org/10.3390/math9243257.
26 When comparing across regression models, one cannot directly compare the coefficients if the dependent variables have different scales, as the effect sizes will be associated with differing units. Since GDP per capita, FDI inflows, and export diversification each have different scales, we opted to use the correlation between the determinant variable and economic outcome variable—rather than the regression coefficients—for our heatmaps. This was intended to ensure comparability across variable relationships. (The Pearson correlation has a standardized scale between -1 and 1.)
27 The p-values of the regressions with governance indices as independent variables and economic indicators as dependent variables are more significant on average than the relationships in the reverse direction. Most notably, governance indices are consistently strong determinants of FDI inflows, while the level of FDI inflows is a very weak determinant for each of the governance indices.
28 World Bank, “Worldwide Governance Indicators;” Haver Analytics Database.
29 In the Legatum Prosperity Index, Social Capital is one of the index’s 12 pillars, which includes the “Civic and Social Participation” (CSP) element. CSP measures the amount to which people participate within a society. It is made up of four sub-indicators such as whether they donated to charity, voiced opinion to a public official, or volunteered. It also incorporates data on voter participation, which we have excised from this analysis. The indicators that do not involve voter participation are based on data from Gallup. See Legatum Institute, Changes Made Since 2020 Index: Summary of Indicator Details, Study, (London, UK: Legatum Institute, 2021), 29, https://docs.prosperity.com/3716/3643/5991/The_2021_Methodology_-_Part_3_-_Sources_And_Indicators.pdf.
30 World Bank, “Worldwide Governance Indicators;” Haver Analytics Database.
31 Ibid.
32 Ibid.
Related
Publications
view more

Industrial policy, which is the proactive effort by governments to support strategic industries, is experiencing a global resurgence after years of neglect. However, even when interest waned globally, industrial policy…
learn more
The Trump Administration began the morning of February 3, 2025, by telling staff and contractors of the United States Agency for International Development (USAID) to stay home. Elon Musk and…
learn more